BLM Climate Engine - Drought & Production
Training Structure and Slides
The training was recorded and is available on the Climate Engine YouTube Channel. This training recording is embedded throughout this article with timestamped clips for each section. The slides from the training are available below.
Access the slides at this link.
Self-paced Study
This page mirrors the workshop agenda and demos. Each section starts with a timestamped, embedded clip from the full recording.
Sections in this training
- Introduction & Session Overview
- Background: How to think about drought signals vs vegetation response
- Drought monitoring in Climate Engine
- Demo 1: 2017 Northern Plains flash drought
- Vegetation production monitoring in Climate Engine
- Vegetation Production Report walk-through
- Practitioner Highlight (Nicole Hupp)
- Demo 2: Production response after pinyon–juniper treatment
- Closing, Contacts & Resources
Full Recording
Introduction & Session Overview
This thematic training focuses on using Climate Engine tools to evaluate drought conditions and vegetation production outcomes for resource monitoring and management decision support. The session moves from dataset background into hands-on workflows, including using BLM Feature Summaries, new Climate Engine Vegetation Production Reports, and two case-study demonstrations (flash drought and vegetation treatment response).
You should come away better able to: - choose climate, drought, and production indicators that match your decision timeframe and question; - interpret how climate signals (precipitation and evaporative demand) relate to vegetation response; - use Climate Engine Reports (reports.climateengine.org) and the web app (app.climateengine.org) to generate shareable, decision-ready maps and time series figures.
Background: How to think about drought signals vs vegetation response
A key theme early in the session is that different drought indicators are measuring different aspects of drought, so it is normal for some indicators to diverge. For example, vegetation impacts can be strongly influenced by evaporative demand (temperature, wind, humidity) even when precipitation totals may be near normal, and vegetation response may respond to drought differently by plant functional group.
The training reinforces a practical approach to treat drought indicators as complementary evidence and interpret them alongside vegetation and hydrologic responses rather than expecting a single index to fully explain drought impacts to vegetation and water resources.
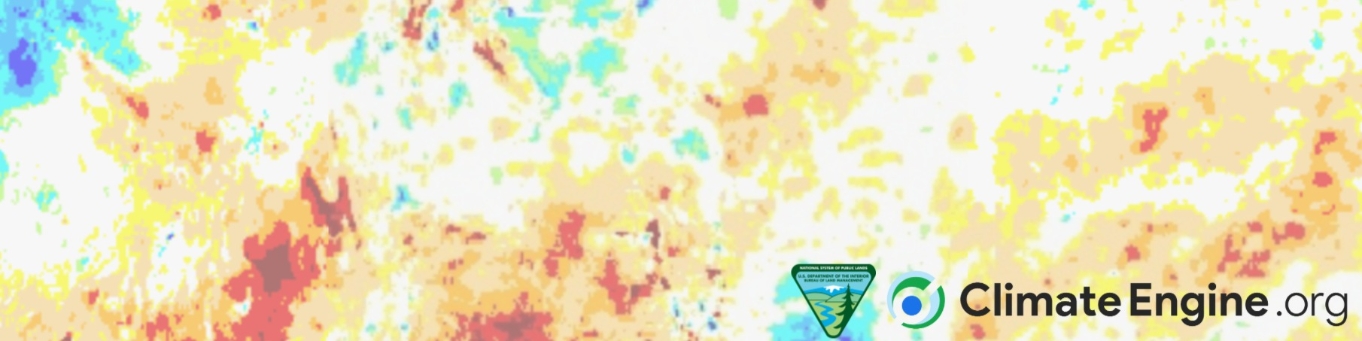
Drought monitoring in Climate Engine
This section introduces a practical drought workflow in the Climate Engine app that includes exploratory analysis, producing maps, and performing reporting. The demonstration emphasizes how reports, maps, and figures are designed to support interpretation across multiple timescales of drought, including “short-term vs long-term” drought periods and provides supporting context for interpreting the meaning of drought categories.
Two tools highlighted here are: - Feature summaries for targeting BLM land units (allotments, field offices, district offices, state offices) that are experiencing the most severe drought conditions, and - Pre-computed drought reports that package maps and charts in an easy to use format for use decision processes.
Demo 1: 2017 Northern Plains flash drought
This case study demonstrates how rapid drought development can be driven by atmospheric demand. The session uses the 2017 Northern Plains flash drought event to show how unusually warm conditions and related drivers can quickly draw down soil moisture and intensify impacts over a short period, and why that matters when selecting indicators for early warning and for characterizing drought conditions more generally.
Vegetation production monitoring in Climate Engine
The production section of this workshop highlights how to interpret satellite-based vegetation production data and to pair it with drought context. A primary dataset discussed is the Rangeland Analysis Platform (RAP) Production data, which provides annual and intra-annual (16-day) production estimates and supports separating production by functional group (annual vs perennial herbaceous) for management interpretation.
The workflow emphasizes comparing current-year conditions to historical context and using functional group splits (annual herbaceous vs. perennial herbaceous) to make the results more applicable for certain management decisions, such as assessments of forage.
Vegetation Production Report walk-through
This segment walks through how the Climate Engine Vegetation Production Reports are organized and how to use them. The training highlights how the report provides information on the current status (current production patterns), vegetation trends, historical context (percentiles, distributions, and long-term patterns), and climate context to support interpretation of potential drivers.
BLM Practitioner Highlight (Nicole Hupp)
The session includes a BLM practitioner highlight featuring Nicole Hupp (State Monitoring Coordinator, Montana–Dakotas State Office), focused on how drought, production, and other remotely sensed (e.g. RAP, RCMAP fractional vegetation cover) products are applied in real monitoring and communication contexts.
In particular, this session highlights:
- Uses of remote sensing data alongside field data from the Assessment, Inventory, and Monitoring (AIM) data.
- How remote sensing data can be used in locations where there is little or no field monitoring data.
- Challenges and opportunities of early adopters of remote sensing data — and the need for more examples!
Demo 2: Production response after pinyon–juniper treatment
This demo applies uses RAP Production and gridMET precipitation data to evaluate outcomes after pinyon–juniper treatment in eastern Nevada. The key result emphasized in the slides is that post-restoration perennial production is substantially higher than the pre-restoration baseline, with a stronger response from perennial bunchgrasses than annual herbaceous production.
The intent of the demo is not only to demonstrate outcomes of broad-scale management to benefit rangeland ecosytems, but to model a repeatable structure for outcome evaluation, including defining baseline vs post-treatment periods, focusing on production from specific functional groups, and interpreting results alongside climate context.
Closing, Contacts & Resources
This session emphasizes that you do not need to code to apply the core workflows shown: the focus is on using Reports and the Climate Engine Web App for exploratory analysis, figure generation, and sharing outputs with colleagues.
Resources
- Website: https://climateengine.org
- Reporting site: https://reports.climateengine.org
- Support site: https://support.climateengine.org
- API documentation: https://docs.climateengine.org
Instructor contacts
- Kristen O’Shea — kristen.oshea@dri.edu
- Eric Jensen — eric.jensen@dri.edu