NADM
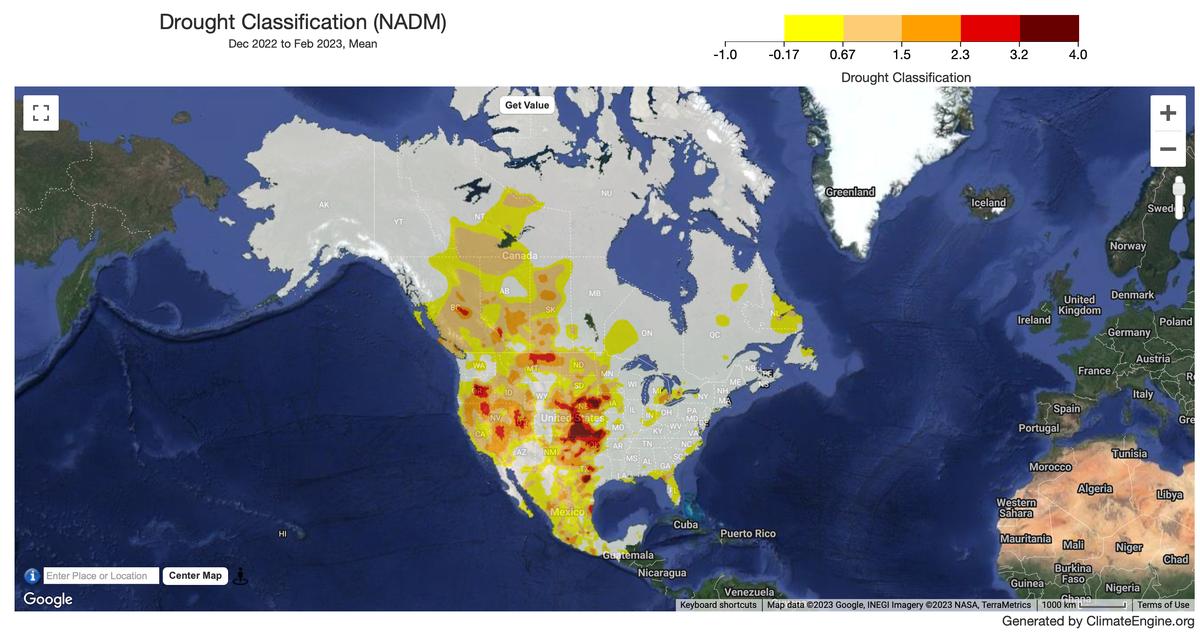
Climate/Hydrology · Climate Engine ID: NADM
Dataset specifications
| Spatial resolution | 2.5km |
|---|---|
| Temporal frequency | Monthly |
| Geographic coverage | North America |
| Period of record | 2001–Present |
Overview
The North American Drought Monitor (NADM) raster dataset is produced by the National Centers for Environmental Information (NCEI) and the National Oceanic and Atmospheric Administration's (NOAA) National Integrated Drought Information System (NIDIS).
Variables
1 variable available.
| Variable | Units |
|---|---|
| North American Drought Monitor Classification | — |
Source and access
Source catalog: ClimateEngine.org
Earth Engine assets
projects/climate-engine/nadm/monthly
Usage and attribution
Processing notes
No processing notes provided.
References
- Heim, Jr., R. R., 2002. A review of Twentieth-Century drought indices used in the United States. Bulletin of the American Meteorological Society, 83, 1149-1165.
- Lawrimore, J., et al., 2002. Beginning a new era of drought monitoring across North America. Bulletin of the American Meteorological Society, 83, 1191-1192.
- Lott, N., and T. Ross, 2000. NCDC Technical Report 2000-02, A Climatology of Recent Extreme Weather and Climate Events. [Asheville, N.C.]: National Climatic Data Center.
- Svoboda, M., et al., 2002. The Drought Monitor. Bulletin of the American Meteorological Society, 83, 1181-1190.
Terms of use
This is a public dataset. As a condition of using these data, you are asked to cite the use of this data set.